1
Create a read-only monitoring user
Grant just enough to read status and process information, never use your application's own database credentials for monitoring.
CREATE USER 'zynty_ro'@'%' IDENTIFIED BY 'STRONG_PASSWORD';
GRANT PROCESS, REPLICATION CLIENT, SELECT ON performance_schema.* TO 'zynty_ro'@'%';
FLUSH PRIVILEGES;
2
Restrict the user to your collector's IP (recommended)
Scope the host part of the user to your collector's address rather than a wildcard once you've confirmed connectivity.
RENAME USER 'zynty_ro'@'%' TO 'zynty_ro'@'10.20.0.50';
3
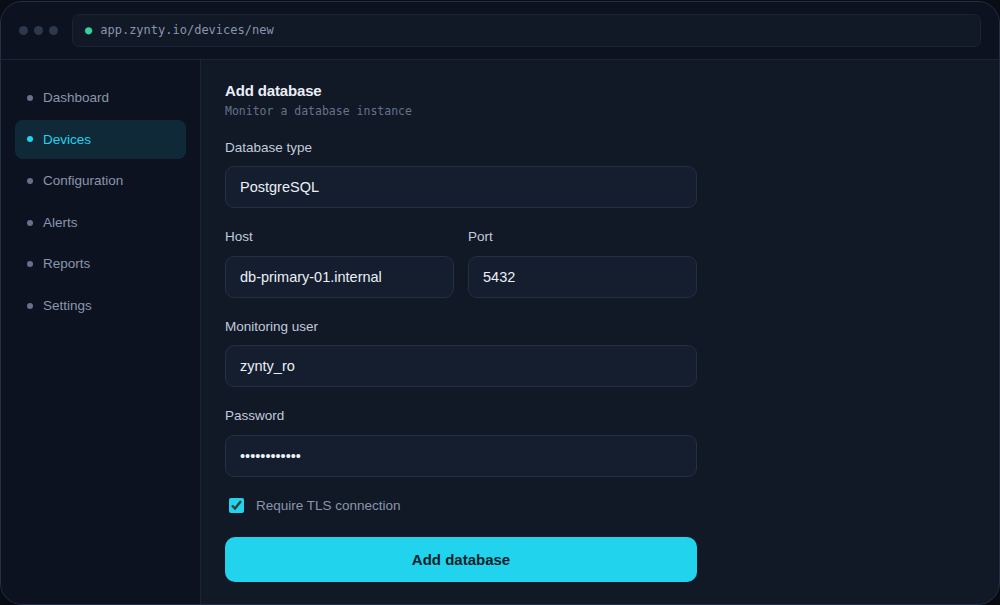
Add the database in Zynty
Choose MySQL as the database type, and enter the host, port, and the monitoring user's credentials.
1
2
3
4
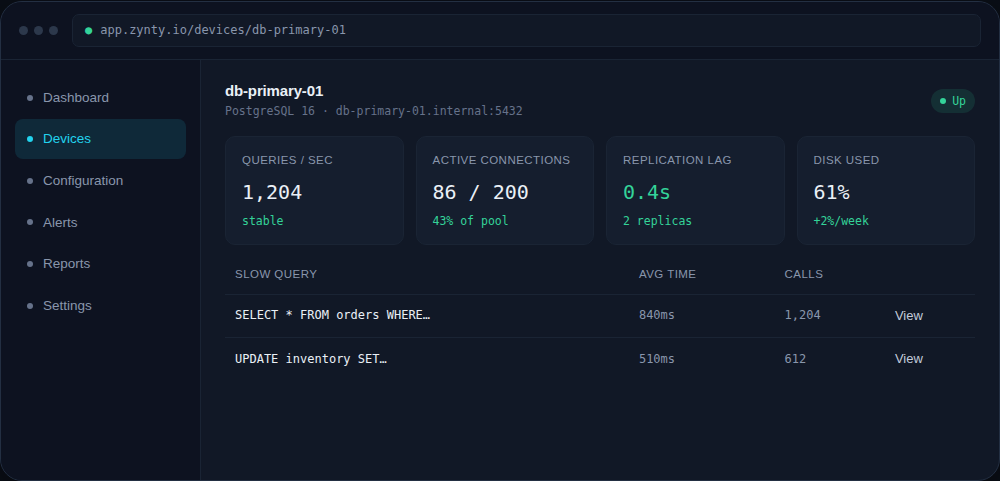
Review the metrics
Once connected, the device's dashboard shows queries per second, connection pool usage, replication lag (if applicable), and the slowest queries in the current window.
1
2