1
How the map is built
Zynty builds topology from a combination of SNMP neighbor discovery (LLDP/CDP), routing tables, and manually defined links, no separate mapping tool required.
2
Read device status by color
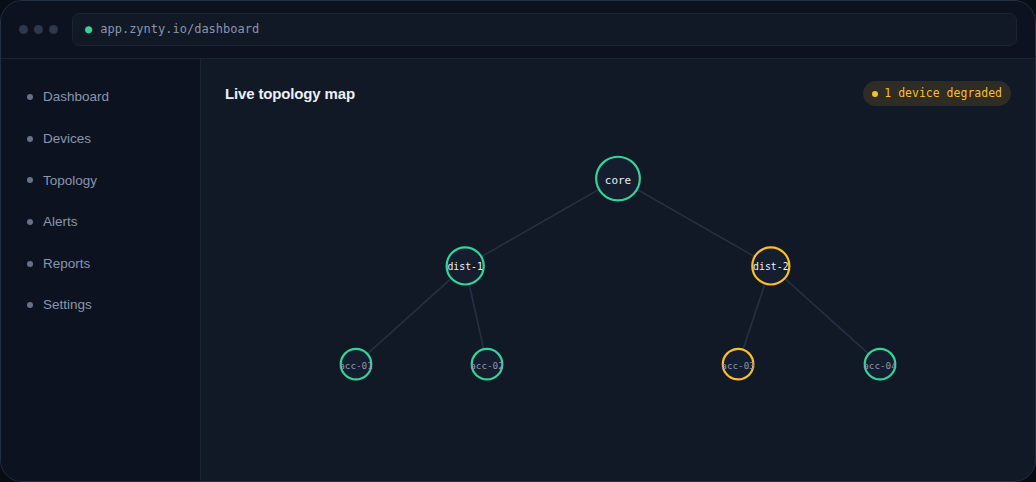
Green means healthy, amber means degraded (a threshold breached but the device is still up), red means unreachable. A degraded node stands out before it becomes a full outage.
1
3
Trace blast radius during an incident
Click any node to highlight everything downstream of it, useful for quickly answering "what else is affected" when a core or distribution device goes down.
4
Export for documentation
Export the current topology as an image or PDF, handy for change requests, onboarding new team members, or NIS2 asset-inventory evidence.